DLC Releases Q2-2023 Results; YTD Funded Volumes of $24.6 Billion
Vancouver, British Columbia – August 9, 2023 – Dominion Lending Centres Inc. (TSX:DLCG) (“DLCG” or the “Corporation”) is pleased to report its financial results for the three months ended June 30, 2023 (“Q2-2023”) and six months ended June 30, 2023. For complete information, readers should refer to the interim financial statements and management discussion and analysis which are dated August 9, 2023 and available on SEDAR at www.sedar.com and on the Corporation’s website at www.dlcg.ca. All amounts are presented in Canadian dollars unless otherwise stated.
DLCG includes the Corporation and its three main subsidiaries: MCC Mortgage Centres Canada Inc. (“MCC”), MA Mortgage Architects Inc. (“MA”), and Newton Connectivity Systems Inc. (“Newton”).
Q2-2023 Summary
- Q2-2023 funded volumes of $14.8 billion, representing a 32% decrease as compared to the three months ended June 30, 2022 (“Q2-2022”);
- Q2-2023 revenue of $15.5 million, representing a 29% decrease as compared to Q2-2022;
- Q2-2023 Adjusted EBITDA of $5.2 million as compared to $13.4 million during Q2-2022, representing a 61% decrease over the prior year period;
- The Corporation incurred a net loss for Q2-2023 of $3.2 million as compared to net income of $6.7 million in Q2-2022, primarily due to a non-cash finance expense on the Preferred Share Liability of $6.2 million compared to an expense of $2.5 million in Q2-2022;
- The Corporation declared a quarterly dividend of $0.03 per class A common share (“Common Share”), resulting in a dividend payment of $1.4 million in Q2-2023; and
- During Q2-2023, the Corporation made repurchases under the normal-course issuer bid (“NCIB”) of 70,167 Common Shares at an average price of $2.57 per share.
Gary Mauris, Executive Chairman and CEO, commented, “The Canadian real estate market continued to face headwinds in Q2-2023 largely due to increased interest rates contributing to lower housing transactions across the market, resulting in a decrease in our funded volumes of 32% from Q2-2022. Our adjusted EBITDA margins have suffered due to our fixed cost structure, but margins did improve in Q2-2023 rising to 33% from 23% in Q1-2023. We anticipate seeing further recovery in our margins and mortgage volumes, as we expect the market to stabilize over the next 12-18 months. We will continue to focus on the onboarding of our brokers onto our proprietary connectivity platform Velocity and expanding our network of mortgage professionals and franchises through continued targeted recruiting initiatives.”
Selected Consolidated Financial Summary:
Below is the summary of our financial results for the three and six months ended June 30, 2023 and June 30, 2022.
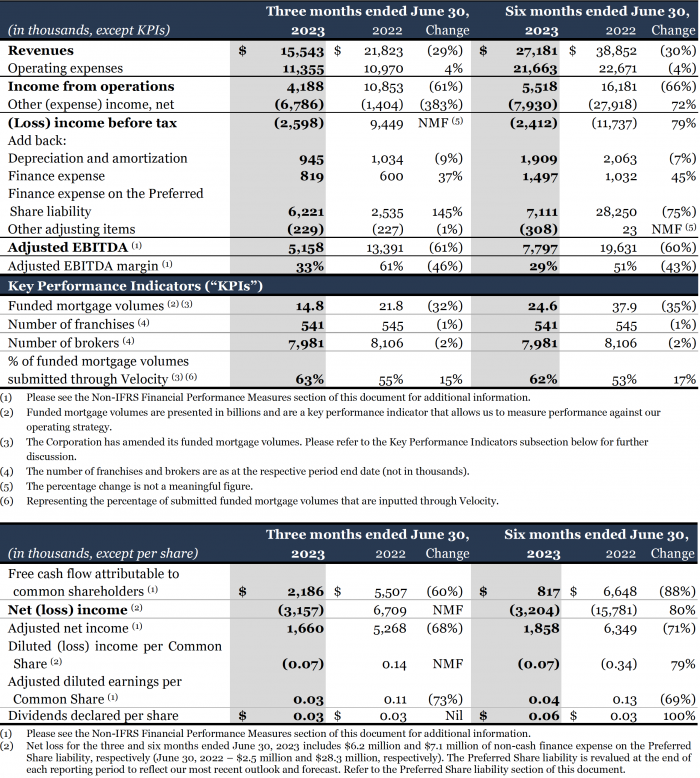
With a decrease in housing sales activity due largely to increased interest rates, the Corporation saw a decline in funded mortgage volumes during the three and six months ended June 30, 2023, resulting in lower revenues, driving down income from operations when compared to the same periods in the previous year. Further decreasing income from operations was:
– an increase in advertising expense associated with the recommencement of certain corporate events; and
– higher advertising fund expenditures due to the timing of advertising initiatives.
Partly offsetting the decreases to income from operations are:
– a higher share-based payment recovery, primarily from a decrease in the Corporation’s share price since December 31, 2022, and fewer restricted share units outstanding and no phantom share units outstanding as at June 30, 2023 when compared to June 30, 2022; and,
– a decrease in legal fees during the six months ended June 30, 2023, when compared to the prior year period.
The decrease in income from operations drove the decrease in adjusted EBITDA and adjusted EBITDA margins during the three and six months ended June 30, 2023, when compared to the same periods in the previous year. The Corporation’s operating expenses are largely fixed in nature and do not generally commensurate with changes in revenues; as such, a decrease in revenues results in a more pronounced decrease in adjusted EBITDA margins. However, the Corporation’s adjusted EBITDA margin has improved during the three months ended June 30, 2023 at 33%, compared to 23% during the three months ended March 31, 2023, as funded mortgage volumes increased quarter over quarter (as Q1 is typically the lowest quarter).
The Corporation incurred a net loss during the three months ended June 30, 2023, when compared to net income during the three months ended June 30, 2022, primarily due to higher other expenses and lower income from operations. Other expenses increased primarily due to higher finance expense on the Preferred Share liability of $3.7 million, from a revaluation expense during 2023, compared to a revaluation recovery in 2022. The increase in the Dividend Entitlement since the first quarter of 2023, moving from negative to positive; and changes in our outlooks and forecast, resulted in a revaluation expense for the second quarter of 2023. During the six months ended June 30, 2023, net loss decreased when compared to the previous year period, primarily from a revaluation recovery on the Preferred Share liability, as a result of a softening of the Corporation’s outlook and forecast for the 2023 fiscal year since its prior forecast period in the fourth quarter of 2022.
Adjusted net income for the three and six months ended June 30, 2023 decreased compared to the same periods in the previous year primarily from lower income from operations driven by decreased revenues from lower funded mortgage volumes. The decrease in adjusted net income contributed to the decrease in free cash flow attributable to common shareholders during the three and six months ended June 30, 2023, when compared to the same periods in 2022. Further decreasing free cash flow attributable to common shareholders was an increase in maintenance capital expenditures, as the Corporation continues its franchise renewal efforts.
Key performance indicators
During the three months ended June 30, 2023, the Corporation determined that its information technology (“IT”) system had excluded certain renewals from a limited number of alternative lenders from its funded mortgage volume totals; and duplicated certain volume transactions, as volume data is transferred between systems. As a result, the Corporation has restated its previously disclosed funded mortgage volumes for fiscal 2021, fiscal 2022 and for the three months ended March 31, 2023. The change to funded mortgage volumes does not change revenues, as the Corporation received the appropriate amounts for its funded mortgage volumes. As management is continuing to review and amend the reports from its IT system to ensure the appropriate inclusion of certain renewals from certain alternative lenders and appropriate transfer of data, these numbers are subject to further changes. Refer to the Second Quarter Financial Results section of the Corporation’s MD&A dated August 9, 2023, for the three and six months ended June 30, 2023, for further information on key performance indicators. The Corporation’s MD&A is available on SEDAR at www.sedar.com.
Non-IFRS Financial Performance Measures
Management presents certain non-IFRS financial performance measures which we use as supplemental indicators of our operating performance. These non-IFRS measures do not have any standardized meaning, and therefore are unlikely to be comparable to the calculation of similar measures used by other companies and should not be considered in isolation or as a substitute for measures of performance prepared in accordance with IFRS. Non-IFRS measures are defined and reconciled to the most directly comparable IFRS measure. Non-IFRS financial performance measures include Adjusted EBITDA, Adjusted net income, Adjusted earnings per share, and free cash flow. Please see the Non-IFRS Financial Performance Measures section of the Corporation’s MD&A dated August 9, 2023, for the three and six months ended June 30, 2023, for further information on key performance indicators. The Corporation’s MD&A is available on SEDAR at www.sedar.com.
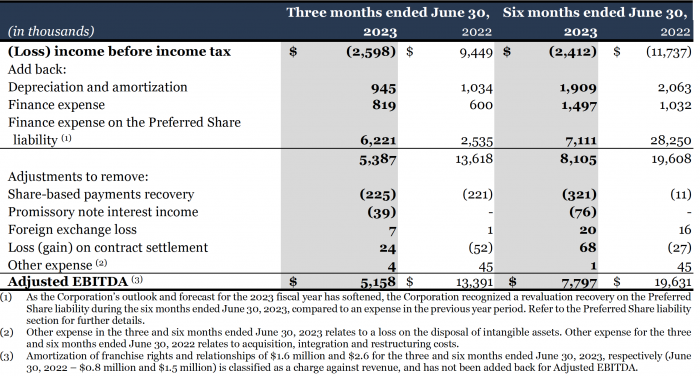
The following table reconciles adjusted EBITDA from (loss) income before income tax, which is the most directly-comparable measure calculated in accordance with IFRS:
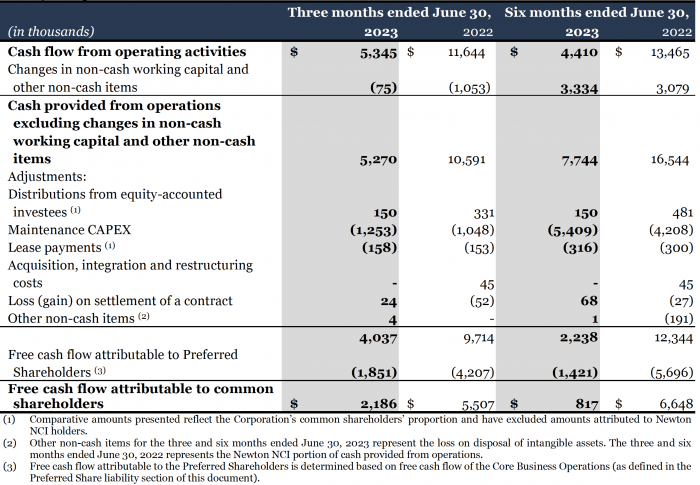
The following table reconciles free cash flow from cash flow from operating activities, which is the most directly-comparable measure calculated in accordance with IFRS:
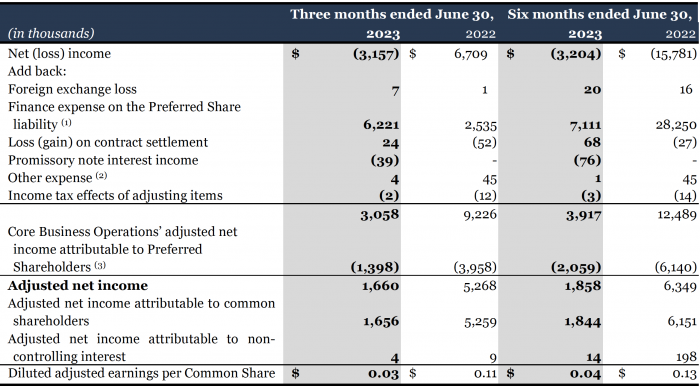
The following table reconciles adjusted net income from net (loss) income, which is the most directly comparable measure calculated in accordance with IFRS:
Forward-Looking Information
Certain statements in this document constitute forward-looking information under applicable securities legislation. Forward-looking information typically contains statements with words such as “anticipate,” “believe,” “estimate,” “will,” “expect,” “plan,” or similar words suggesting future outcomes or an outlook. Forward-looking information in this document includes, but is not limited to: our anticipation of further recovery in our margins and mortgage volumes as we expect the market to stabilize over the next 12-18 months.
Such forward-looking information is based on many estimates and assumptions, including material estimates and assumptions, related to the following factors below that, while considered reasonable by the Corporation as at the date of this MD&A considering management’s experience and perception of current conditions and expected developments, are inherently subject to significant business, economic and competitive uncertainties and contingencies. Known and unknown factors could cause actual results to differ materially from those projected in the forward-looking statements. Such factors include, but are not limited to:
- • Changes in interest rates;
- • The DLC Group’s ability to maintain its existing number of franchisees and add additional franchisees;
- • Changes in overall demand for Canadian real estate (i.e. such as immigration);
- • Changes in overall supply for Canadian real estate (i.e. such as new housing start levels);
- • At what period in time, the Canadian real estate market stabilizes;
- • Changes in Canadian mortgage lending and mortgage brokerage laws;
- • Material decreases in the aggregate Canadian mortgage lending marketplace;
- • Changes in the fees paid for mortgage brokerage services in Canada;
- • Changes in the regulatory framework for the Canadian housing and lending sectors;
- • Demand for the Corporation’s products remaining consistent with historical demand.
Many of these uncertainties and contingencies may affect our actual results and could cause actual results to differ materially from those expressed or implied in any forward-looking statements made by, or on behalf of, us. Readers are cautioned that forward-looking statements are not guarantees of future performance. All forward-looking statements made in this document are qualified by these cautionary statements. The foregoing list of risks is not exhaustive. The forward-looking information contained in this document is made as of the date hereof and, except as required by applicable securities laws, we undertake no obligation to update publicly or revise any forward-looking statements or information, whether because of new information, future events or otherwise.
About Dominion Lending Centres Inc.
Dominion Lending Centres Inc. is Canada’s leading network of mortgage professionals. DLCG operates through Dominion Lending Centres Inc. and its three main subsidiaries, MCC Mortgage Centre Canada Inc., MA Mortgage Architects Inc. and Newton Connectivity Systems Inc., and has operations across Canada. DLCG extensive network includes ~7,980 agents and ~541 locations. Headquartered in British Columbia, DLC was founded in 2006 by Gary Mauris and Chris Kayat.
DLCG can be found on Twitter, Facebook and Instagram and LinkedIn @DLCGmortgage and on the web at www.dlcg.ca.”
| James Bell Co-President 403-560-0821 jbell@dlcg.ca | Robin Burpee Co-Chief Financial Officer 403-796-5429 rburpee@dlcg.ca |
NEITHER THE TSX EXCHANGE NOR ITS REGULATION SERVICES PROVIDER (AS THAT TERM IS DEFINED IN THE POLICIES OF THE TSX EXCHANGE) ACCEPTS RESPONSIBILITY FOR THE ADEQUACY OR ACCURACY OF THIS RELEASE.